The Support home screen
Home is where you start a request and see what has happened to your latest tickets.
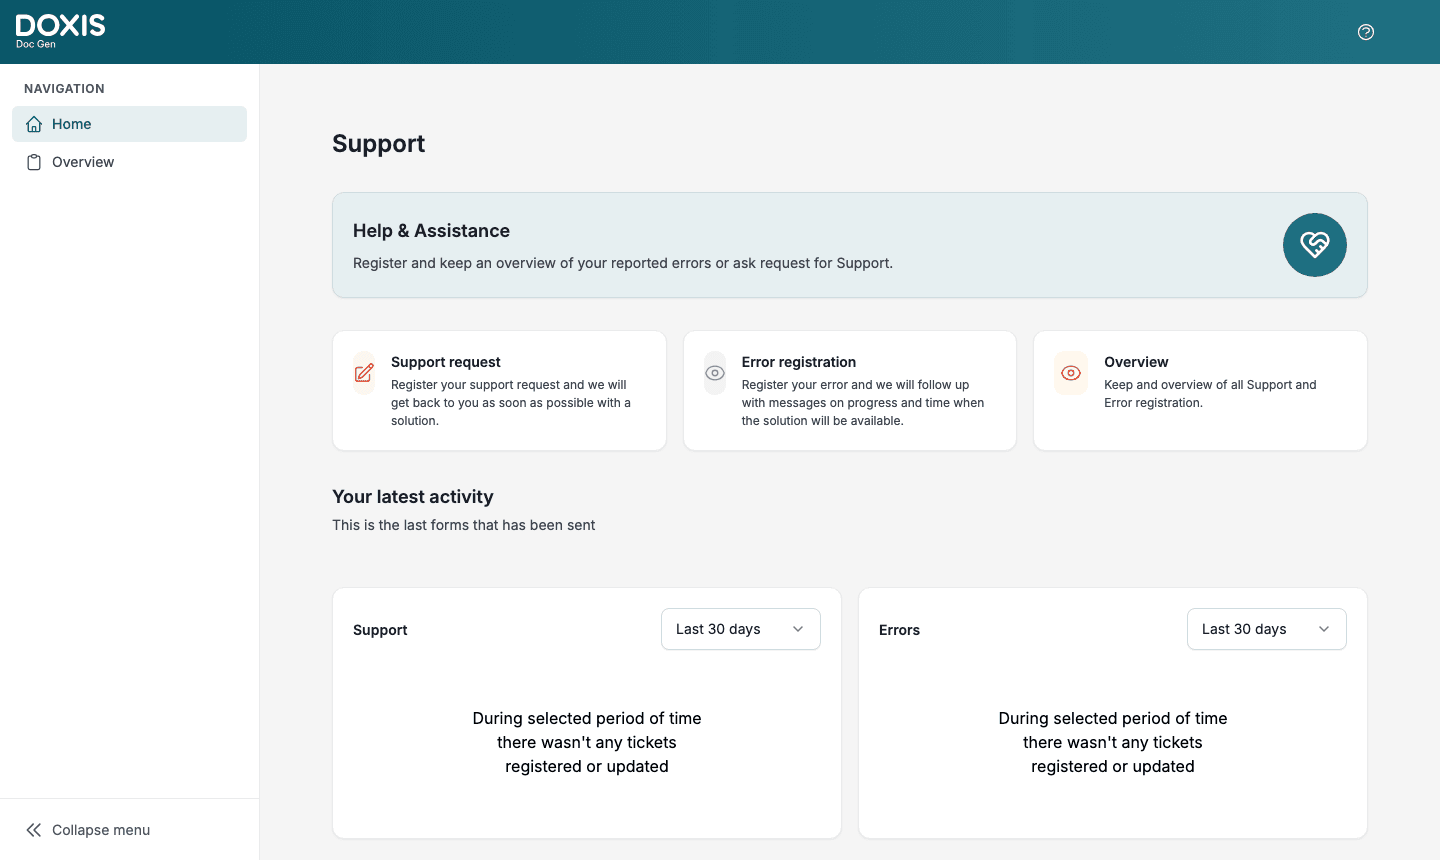
- The navigation on the left has Home and Overview. Click Collapse menu to make it narrower.
- The Help & Assistance banner says what the application is for.
- The tiles Support request, Error registration and Overview. The first two open a form, see Register a request. Overview opens the ticket list.
- Your latest activity lists the most recently updated tickets of your company, followed by the charts.
- The period selector on each chart.
- The help icon in the top bar opens this documentation.
Your latest activity
The list shows the five tickets of your company that were updated most recently, newest first. Each row has:
- the subject, which opens the ticket form in a new tab
- the type, Support or Error
- Updated on with the date and time
- the status as a badge, for example Registered or Done
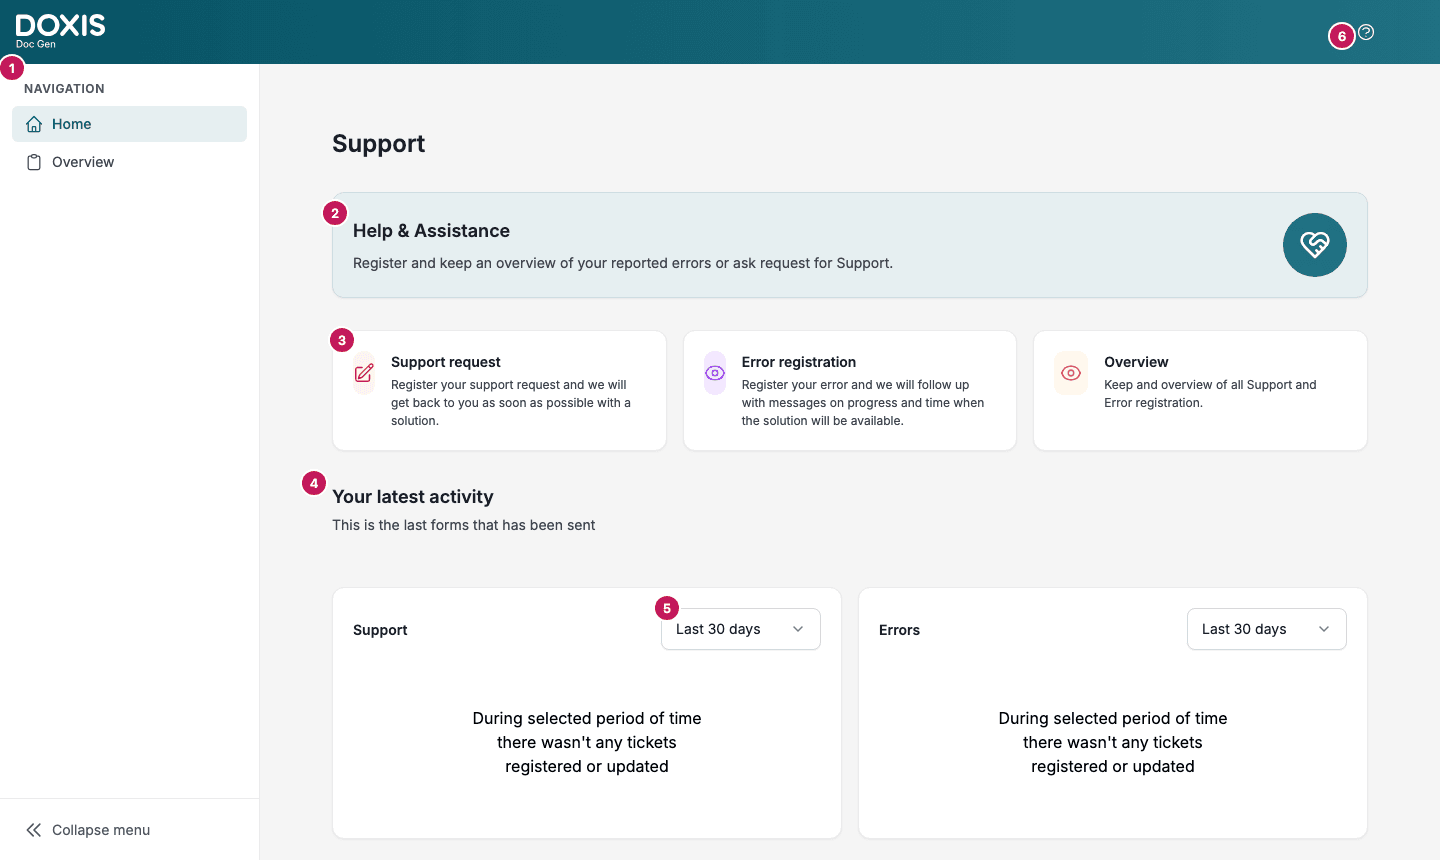
Until your company has registered its first ticket, only the heading shows here.
Statistics
Below the list there is one chart for Support and one for Errors. The Support chart only shows when your company has a Service-Level Agreement licence.
- Choose Last 7 days, Last 30 days, Last 90 days or Last 12 months to set the period. The default is Last 30 days.
- Each slice is a status. The numbers show how many tickets have that status, and the number in the middle is the total. A status with no tickets in the period is not drawn.
- The legend under the chart names the statuses that are drawn, using the names Registered, InProgress, Finished, Investigation, Test, Removed, Pending and Delivered. InProgress is the status called In progress in Overview, and Finished is Done.
- Click a slice to open Overview with the list filtered to that type, status and period. The type and status are ticked in the filter, but Date from still shows the default date, so clicking Search there widens the list to that date.
- The charts count tickets by the date they were created.
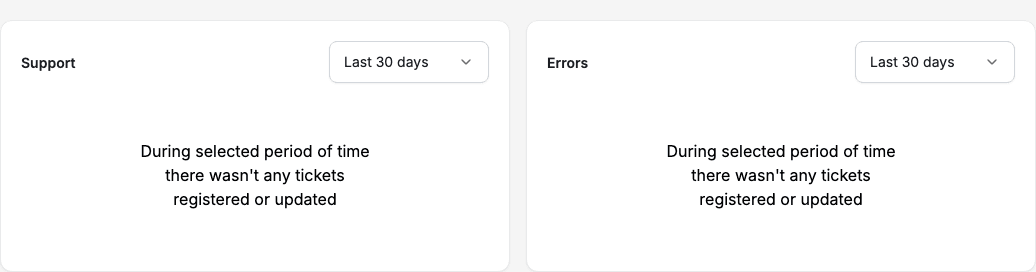
When no ticket was registered in the chosen period, the chart shows During selected period of time there wasn’t any tickets registered or updated. Choose a longer period to look further back.