Test your Smartform
While you design a Smartform, you can open it the way a person will see it, fill it in and find out why it behaves as it does. This page shows how to open the Smartform from the designer and how to use the Debug Panel, a panel that explains what the Smartform is doing.
Create a form from the designer
- Open the Smartform in the Design tab.
- In the Actions tab on the left, click Create Form.
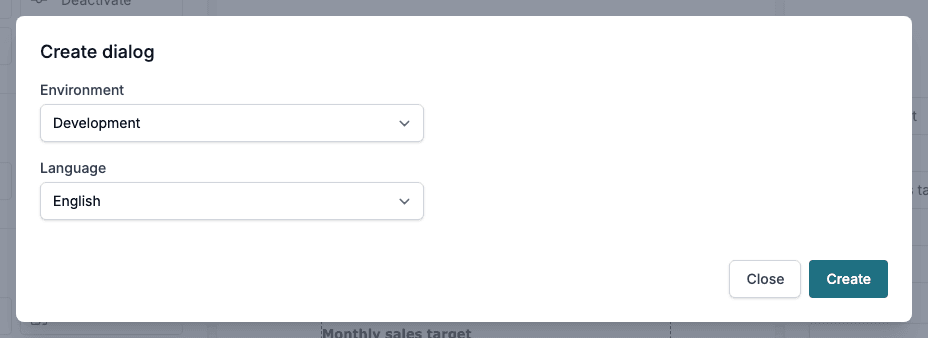
- In the Create dialog window, choose the settings below and click Create.
| Setting | What it does |
|---|---|
| Environment | The environment to open the Smartform from. The list holds Development and every environment that the Smartform has been published to. See Deployment |
| Language | The language of the form. It starts with the default language of the Smartform. Add languages on the Translations tab |
| Dataset | Only shown when the Smartform has datasets. The form starts with the values of the dataset you choose. - starts with empty fields |
The form opens in a new browser tab. Each time you click Create you get a new record, so you can test as many times as you like. The records are listed on the Records tab.
What Studio does for you
- Development shows the current design. When the Smartform has changes that are not published, Studio publishes them first, so that the form shows what you see in the designer. The changes end up in Development as a new version.
- Test, Pre Production and Production show the version that has been promoted to that environment. Studio does not publish anything for these, because publishing in Development would not change them.
- When the Smartform is Inactive, Studio activates it.
You do not need to click Publish and Activate before you click Create Form.
📝 Note: Create Form cannot be clicked when Select process style on the Process tab is set to Process.
The Debug Panel
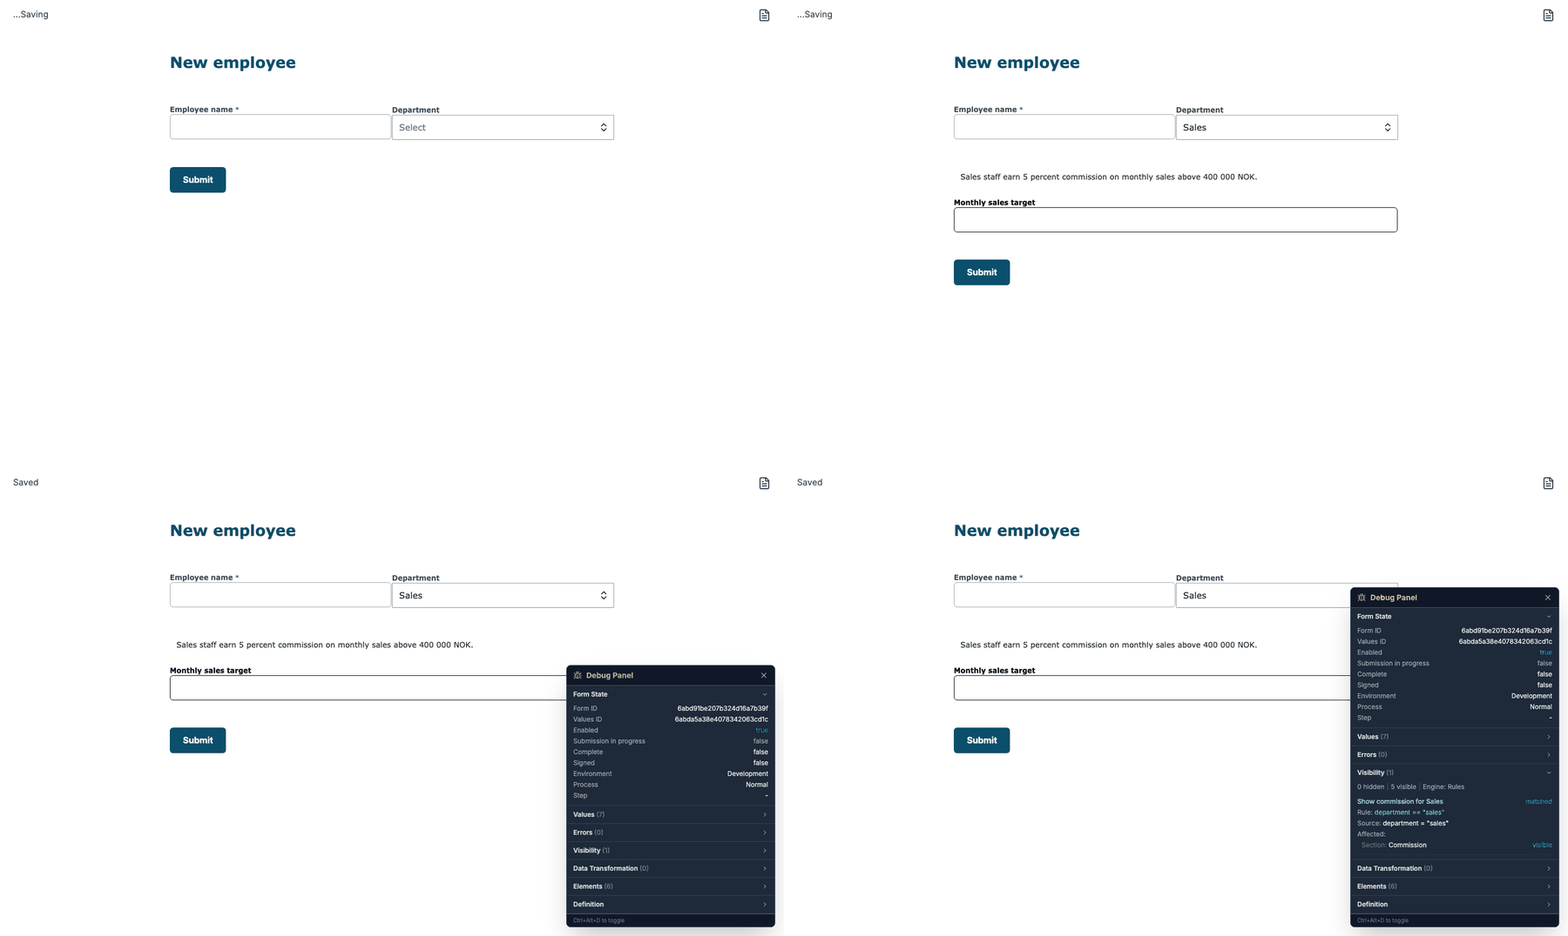
The Debug Panel shows what is going on inside a form that is filled in: what is stored, which rules fired and which parts are hidden. Use it when a field is hidden and you need to know which rule hid it, or when a value is not what you expected.
The Debug Panel is only available on forms that belong to an environment other than Production. Forms in Production never show it.
Open the panel
Open the form, for example with Create Form as described above, and do one of these:
- Press Ctrl+Alt+D.
- Add
debug=trueto the address of the form, for example?languageCode=en&debug=true, and load the page again.
The panel opens at the bottom right of the window. Press Ctrl+Alt+D again, or click the cross at the top of the panel, to close it.
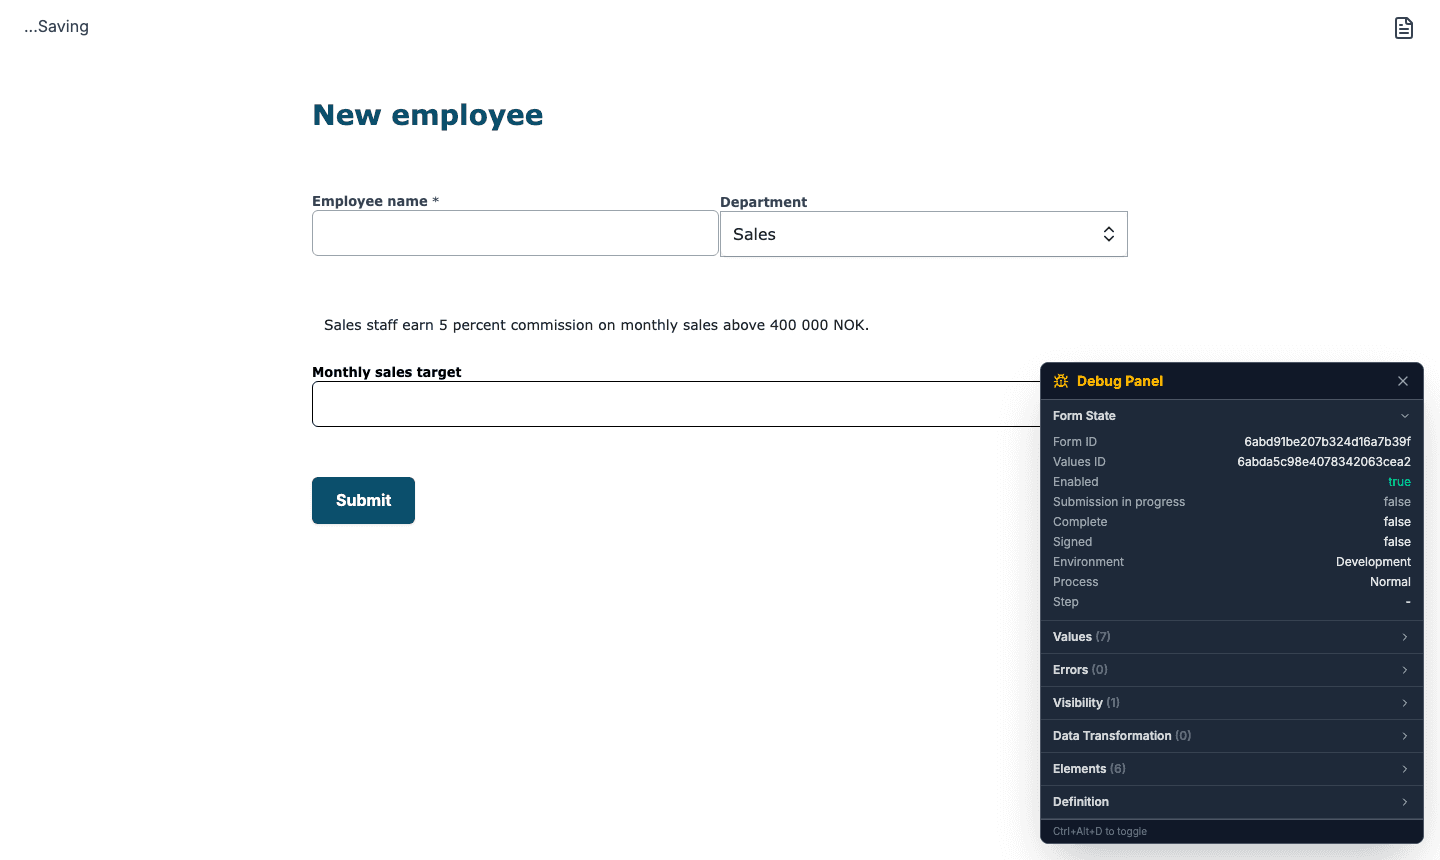
Click the name of a section to open or close it.
| Section | What it shows |
|---|---|
| Form State | The Form ID and Values ID, and whether the form is Enabled, has a Submission in progress, is Complete or Signed. Also the Environment, the Process and the current Step |
| Values | Every value the person has entered, with the name of the field. Type in Search values… to find a field or a value |
| Errors | The fields that have an error, with the message. No errors when everything is fine |
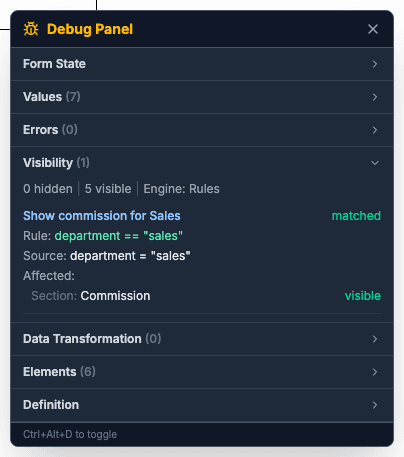
| Visibility | How many parts are hidden and how many are visible, and which rule engine is used. For every Show/Hide rule: its name, whether it is matched or not matched, the condition with the value it read, and the parts it Affected, each marked visible or hidden |
| Data Transformation | The values of the data table, which the Data Transformation rules fill in |
| Elements | Every element of the Smartform with its type, Property name and label. Elements that are left out of the PDF are marked PDF excluded |
| Definition | Name, PDF Engine, Font, Containers (the number of sections), Has Signing, Generate PDF on Submit, Theme and Element Styles |
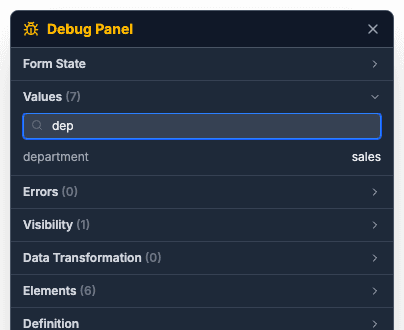
Find out why something is hidden
- Open the form and press Ctrl+Alt+D.
- Open Visibility.
- Find the rule that points at the hidden part. Under Affected you see the name of the section, row or element and whether it is visible or hidden.
- Read the condition of the rule. It shows what the rule expected and the value it read in Source. A value that is not what you expected is the cause.
- Open Values to see what is stored for that field.
📝 Note: The Debug Panel shows the values of the record you are looking at, so do not leave it open when you share your screen with someone who should not see them.